This volume, edited by Lucia Banci, is probably the first real book on metallomics. The table of contents looks very promising, and judging from those bits that I am able to access, I’d love to say that is is a great book... But honestly I can’t. The days when I could persuade the library to purchase (for me) a book, however expensive, are long gone. At the Springer website, eBook is priced at €142.79 and hardcover costs €181.85. You can buy them slightly cheaper from Amazon ($175.82 and $227.05, respectively.)
The book is dedicated to Ivano Bertini, who sadly passed away last year. I was lucky enough to meet the man himself on a few occasions. Ivano was a formidable scientist and one of the most colourful figures of bioinorganic chemistry and structural biology.
Metallomics and the Cell Metal Ions in Life Sciences, vol. 12
Lucia Banci, Editor
Banci, L. and Bertini, I. Metallomics and the cell: some definitions and general comments, pp. 1—13.
Penner-Hahn, J.E. Technologies for detecting metals in single cells, pp. 15—40.
Clausen, M.J.V. and Poulsen, H. Sodium/potassium homeostasis in the cell, pp. 41—67.
Romani, A.M.P. Magnesium homeostasis in mammalian cells, pp. 69—118.
Brini, M., Calì, T., Ottolini, D. and Carafoli, E. Intracellular calcium homeostasis and signaling, pp. 119—168.
Roth, J., Ponzoni, S. and Aschner, M. Manganese homeostasis and transport, pp. 169—201.
Andrews, S., Norton, I., Salunkhe, A.S., Goodluck, H., Aly, W.S.M., Mourad-Agha, H. and Cornelis, P.
Control of iron metabolism in bacteria, pp. 203—239.
Dlouhy, A.C. and Outten, C.E. The iron metallome in eukaryotic organisms, pp. 241—278.
Benson, D.R. and Rivera, M. Heme uptake and metabolism in bacteria, pp. 279—332.
Cracan, V. and Banerjee, R. Cobalt and corrinoid transport and biochemistry, pp. 333—374.
Sydor, A.M. and Zamble, D.B. Nickel metallomics: general themes guiding nickel homeostasis, pp. 375—416.
Rensing, C. and McDevitt, S.F. The copper metallome in prokaryotic cells, 417—450.
Vest, K.E., Hashemi, H.F. and Cobine, P.A. The copper metallome in eukaryotic cells, pp. 451—478.
Maret, W. Zinc and the zinc proteome, pp. 479—501.
Mendel, R.R. Metabolism of molybdenum, pp. 503—528.
Gladyshev, V.N. and Zhang, Y. Comparative genomics analysis of the metallomes, pp. 529—580.
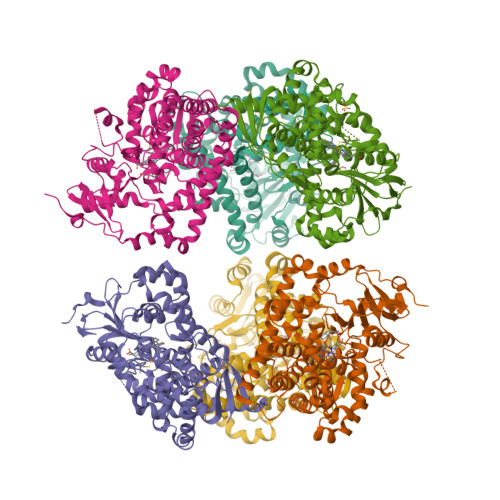
To date, two types of enzymes that are responsible for primary attack of polyisoprene in rubber-degrading microorganisms have been identified [1]. One is the latex clearing protein (Lcp), first isolated from Streptomyces sp., which does not have any metal ions or cofactors [2]. The other is the rubber oxygenase RoxA of Xanthomonas sp., a dihaem c-type cytochrome that cleaves cis-1,4-polyisoprene, the main constituent of natural rubber, to 12-oxo-4,8-dimethyltrideca-4,8-diene-1-al [3, 4]. The crystal structure of RoxA, solved at 1.8 Å resolution, was released today [5].
Rose, K., Tenberge, K.B. and Steinbüchel, A. (2005) Identification and characterization of genes from Streptomyces sp. strain K30 responsible for clear zone formation on natural rubber latex and poly(cis-1,4-isoprene) rubber degradation. Biomacromolecules6, 180—188.
Braaz, R., Fischer, P. and Jendrossek, D. (2004) Novel type of heme-dependent oxygenase catalyzes oxidative cleavage of rubber (poly-cis-1,4-isoprene). Applied and Environmental Microbiology70, 7388—7395.
Schmitt, G., Seiffert, G., Kroneck, P.M.H., Braaz, R. and Jendrossek, D. (2010) Spectroscopic properties of rubber oxygenase RoxA from Xanthomonas sp., a new type of dihaem dioxygenase. Microbiology156, 2537—2548.
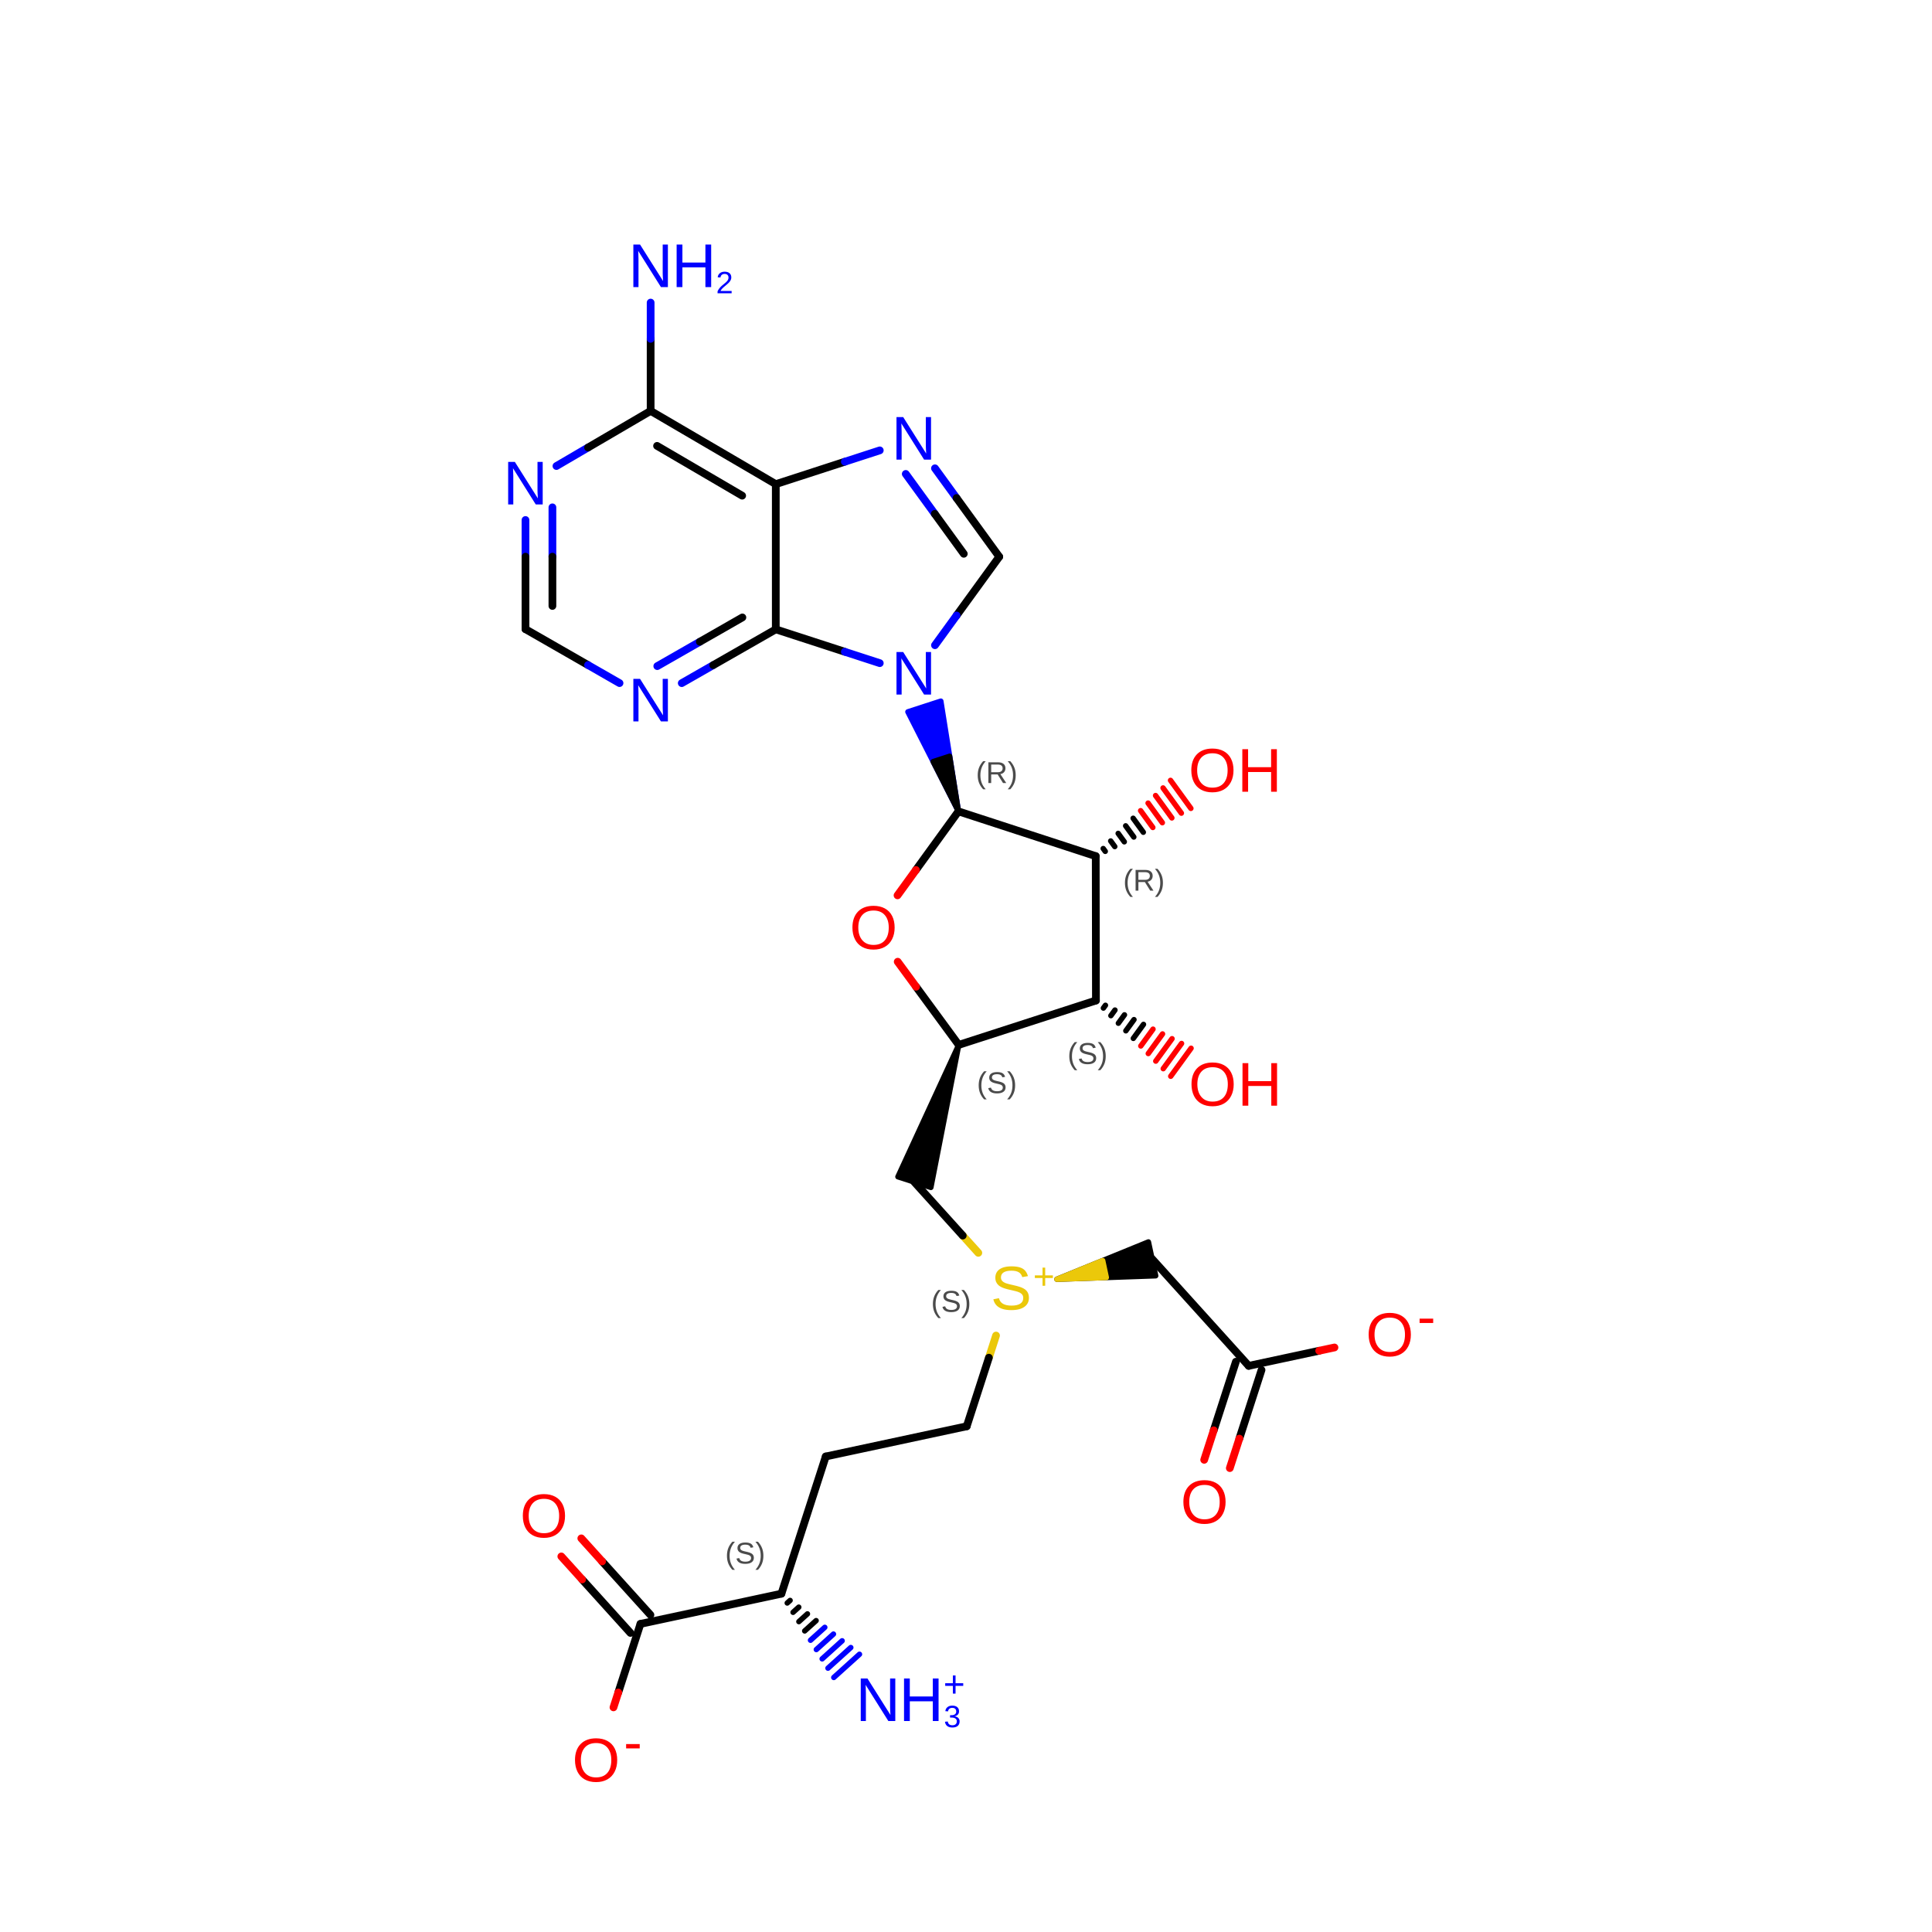
A novel cofactor is not something that is discovered every day, or even every year. So we are lucky this year. The crystal structure of a putative methyltransferase CmoA from Escherichia coli reveals the presence of [(3S)-3-amino-3-carboxypropyl]{[(2S,3S,4R,5R)-5-(6-aminopurin-9-yl)-3,4-dihydroxyoxolan-2-yl]methyl}(carboxymethyl)sulfanium, aka S-adenosyl-S-carboxymethyl-L-homocysteine, aka SCM-SAH [1—3]. Moreover, it was suggested that “a number of enzymes that have previously been annotated as SAM-dependent are in fact SCM-SAH-dependent” [1].
Byrne, R.T., Whelan, F., Aller, P., Bird, L.E., Dowle, A., Lobley, C.M., Reddivari, Y., Nettleship, J.E., Owens, R.J., Antson, A.A. and Waterman, D.G. (2013) S-Adenosyl-S-carboxymethyl-L-homocysteine: a novel cofactor found in the putative tRNA-modifying enzyme CmoA. Acta Crystallographica D69, 1090—1098.
Earlier this year [1], the crystal structures of human aldosterone synthase (CYP11B2) were solved in complex with a substrate 11-deoxycorticosterone [2] and an inhibitor fadrozole [3].
Strushkevich, N., Gilep, A.A., Shen, L., Arrowsmith, C.H., Edwards, A.M., Usanov, S.A. and Park, H.-W. (2013) Structural insights into aldosterone synthase substrate specificity and targeted inhibition. Molecular Endocrinology27, 315—324.
On a number of occasions, I was chilling beer in the freezer. Then taking it out, opening the bottle and pouring it into the glass. There are four experimentally observed outcomes.
Beer is liquid both in a bottle and in a glass
Beer is liquid in a bottle but gets frozen as poured in a glass
Beer gets solid in a bottle so no way to pour it in a glass
Beer bottle explodes in the freezer
Scenario B is the most interesting one. (Scenario D is also interesting, but I won’t recommend it.) This is how the resulting beer slush looks like:
Now I saw a number of articles on the web where they explain this phenomenon with supercooling. I should say that I am not satisfied with this explanation. Why “supercooled” beer is not getting frozen in the bottle, even if I shake it, but forms slush once outside? When I put a bottle of (non-fizzy) rosé in a freezer, it either stays liquid (and remains liquid upon opening and pouring) or develops fine crystals of ice (which stay as they are upon opening both in a bottle and in a glass). On one occasion, a forgotten in a freezer bottle of rosé got frozen solid. (According to The Academic Wino, “the freezing point of table wine is –5 °C”, and my freezer goes down to –18 °C.)
To explain what happens, we don’t need to bring supercooling in. We just have to keep in mind that our drink is an aqueous solution. And that alcohol is only one of many solutes there. Of them, the most important are sugars and carbon monoxide. (Some beers, such as Guinness, contain dissolved dinitrogen as well as CO2.)
For dissolution to take place, the overall change of free energy should be negative, but the heat may be either absorbed or released. The dissolving of sugar in water is an endothermic process. The increase in temperature results in an increase in solubility. The reverse process, precipitation (often in form of crystallisation), is exothermic.
On the contrary, the dissolving of gases in water is exothermic. The increase in temperature results in an decrease in gas solubility. The reverse process, gas evolution, is endothermic. So as soon as the bottle is opened, the gas starts to escape and the temperature drops — in our example, below the freezing temperature. Sometimes, it drops so rapidly that beer freezes in the bottleneck.
And while I am on it: as this video shows, dissolving of alcohol in water is also exothermic. Not that it changes much in our beer glass experiments.
One day, idly browsing the web (as usual), I came across this:
I disagree with an unknown (to me) co-author of Antoine de Saint-Exupéry. For one thing, you don’t have to be “in organic chemistry” to recognise a reaction coordinate diagram. For another, 25 or so years ago my first reaction (that is, if I never read Le Petit Prince) would be: “Hey dude, your CD spectrum is upside down”. The fact is, I am still alive, so my life then was far from being over.
Isn’t the Web great? Nowadays I don’t have to venture to the library and sift through the J. Biol. Chem.’s and J. Mol. Biol.’s. (Even if I wanted, there is no library like that in Fuerteventura.) I can get the CD spectra online and for free in the Protein Circular Dichroism Data Bank [1]. Better still, using DichroMatch I can find spectra that are similar to my query [2]. (I just checked: it works!) Here’s how the CD spectrum of a typical α-helical protein (such as haemoglobin) looks like (a):
(a)
So... where’s a hat? Back in 1990s, our lab had a decommissioned Jobin Yvon Mark IV dichrograph, which, as I understand now, was an excellent machine. The haemoglobin spectrum would look more or less like this (b):
(b)
Neither equipment nor our samples allowed us to collect spectra below 200 nm, therefore most of the spectrum was in the negative ellipticity region. We did not really need to go below 200 nm: we were mostly monitoring ellipticity at 222 nm as a function of temperature or concentration of guanidinium chloride or other denaturing agents.
Mind you, not all proteins have this inverted hat region in their CD spectra. For example, ferredoxin (c), rubredoxin (d) or immunoglobulin G (e):
(c)
(d)
(e)
In the 21st century, protein X-ray crystallography became very much a routine technique. Once you solve the structure, there’s no mystery left. On the contrary, the CD spectra are as beautiful and enigmatic as star spectra. They still need an intelligent interpreter. They tell the story and in the same time keep the secret. I think the little prince would appreciate them.
Whitmore, L., Woollett, B., Miles, A.J., Klose, D.P., Janes, R.W. and Wallace, B.A. (2011) PCDDB: the protein circular dichroism data bank, a repository for circular dichroism spectral and metadata. Nucleic Acids Research39, D480—D486.
Klose, D.P., Wallace, B.A. and Janes, R.W. (2012) DichroMatch: a website for similarity searching of circular dichroism spectra. Nucleic Acids Research40, W547—W552.
CYP1A1 was one of the first P450 enzymes to be characterised and, as its name indicates, holds the first place in the systematic nomenclature of P450s [1]. However, it was not until last year that the first crystal structure of human CYP1A1 in complex with α-naphthoflavone has been determined at 2.6 Å resolution [2]. The structure [3] is released this week.
Naturally, you are supposed to figure this out from the first principles, or rather, from some principles taught in this course, not from Wikipedia (or “by googling”, as some put it).
(a)
(b)
The problem is, the “right” answer, PF3, is actually, factually wrong. Even though this question cost only two points (of 150), a rather animated debate followed the exam.
Those who defended the “right” but factually wrong answer (a) were proposing that what the problem was testing our thinking rather than actual knowledge, and our thinking should have been along the lines of VSEPR model. VSEPR rules correctly predict PF3 to be trigonal pyramidal and PF5 to be trigonal bipyramidal. The dipole moment of a polar molecule PF3 should make it less volatile than apolar PF5. Those who chose the “wrong” but factually correct answer (b) were arguing that polarisability of larger PF5 is higher than that of PF3 and therefore the London dispersion forces in PF5 would beat dipole-dipole interactions in PF3. The (a) party were saying that making the answer you’d get by applying principles different to the one you’d get by “googling” is a good protection against cheating. The (b) party were retorting that this is a silly way of protection, that the question asked was what has the higher boiling point, not what could be expected to have the higher boiling point, and that expecting students to come up with the factually wrong answer is not exactly pedagogical.
Truth to be told, the methods of estimating boiling or melting points of materials were simply not a part of this course. The only thing one could do was to determine whether the molecule has a non-zero dipole moment. But there is no way to figure out which effect will be stronger, the increase in dispersion forces or dipole-dipole interactions.
One would think that the physical properties of such simple compounds as binary halides of Group 15 elements (pnictogens) are studied well and long ago. Not really. I tried to compile a table of dipole moments and melting/boiling points for pnictogen tri- and pentahalides, MX3 and MX5, using various resources [1—5]. As you can see, there are still many gaps.
The dipole moment of MX3 grows larger down the group of the central atom M, e.g. μ(NF3) < μ(PF3) < μ(AsF3), and grows smaller down the group of ligand atom X, e.g. μ(SbCl3) > μ(SbBr3) > μ(SbI3).
As the sizes of both central atom and ligands go up, so do the melting and boiling points.
As dipole moments go up, so do the melting and boiling points.
Something curious happens, though, when one crosses the phosphorus—arsenic borderline. AsF3 has a dipole moment of 2.59 debye. As expected, both mp and bp of AsF3 are, respectively, higher than those of AsF5. PF3, however, has much lower moment of 1.03 D. Both mp and bp of PF3 are, respectively, lower than those of PF5. Similarly, mp of AsCl3 is higher than mp of AsCl5, whereas mp of PCl3 is lower than mp of PCl5. Similarly... but no, there are too many gaps in the table “down there”.
Which shows, by the way, that “googling” does not help if the data is not available. For the future, the course authors may consider asking a very similar question about a pair of compounds from “down there”. Thus the whole conflict between the (as yet unknown) “truth” and “expected answer” could be easily avoided.
Since the electronegativities decrease down the group for both M and L, the most polar M—L bond must be Bi—F bond and BiF3 should have the largest dipole moment. Well I couldn’t find its value. But it is known that bismuth trifluoride has ionic structure, and has the highest melting (649 °C) and boiling (900 °C) points of all binary pnictogen halides. On the other side of the spectrum, we have extremely sensitive nitrogen triiodide. A feather tickle, a loud noise and, I suppose, any attempt to measure its dipole moment will set off an explosive decomposition (see the video below):
This year I don’t have a Christmas tree. (There aren’t many in Fuerteventura.) But I’ve got some models from this week’s new PDB structures [1—5] which look Christmassy enough to decorate my blog.
Merry Christmas and a happy New Year everybody!
Hui, F., Scheib, U., Hu, Y., Sommer, R.J., Aroian, R.V. and Ghosh, P. (2012) Structure and glycolipid binding properties of the nematicidal protein Cry5B. Biochemistry51, 9911—9921.
Lence, E., Tizón, L., Otero, J.M., Peón, A., Prazeres, V.F.V., Llamas-Saiz, A.L., Fox, G.C., van Raaij, M.J., Lamb, H., Hawkins, A.R. and González-Bello, C. (2013) Mechanistic basis of the inhibition of type II dehydroquinase by (2S)- and (2R)-2-benzyl-3-dehydroquinic acids. ACS Chem. Biol.8, 568—577.
Strugatsky, D., McNulty, R., Munson, K., Chen, C.-K., Soltis, S.M., Sachs, G. and Luecke, H. (2013) Structure of the proton-gated urea channel from the gastric pathogen Helicobacter pylori. Nature493, 255—258.
Tang, Q., Gao, P., Liu, Y.-P., Gao, A., An, X.-M., Liu, S., Yan, X.-X. and Liang, D.-C. (2012) RecOR complex including RecR N-N dimer and RecO monomer displays a high affinity for ssDNA. Nucleic Acids Res.40, 11115—11125.
Ziervogel, B.K. and Roux, B. (2013) The binding of antibiotics in OmpF porin. Structure21, 76—87.
The first crystal structures of the 11-haem cytochrome from Shewanella sp. strain HRCR-6 have been solved [1], both ligand-free [2] and in complex with iron chelates Fe(III)-citrate [3] and Fe(III)-nitrilotriacetate [4]. The authors propose that
the region around heme 7 could be a rudimentary active site for association of soluble organic redox partners, which would be consistent with the UndA functioning as an enzyme with broad, but differential, specificity to a variety of substrates, in contrast to a nonspecific cathode on the cell surface <such as decaheme cytochrome MtrF>.
Edwards, M.J., Hall, A., Shi, L., Fredrickson, J.K., Zachara, J.M., Butt, J.N., Richardson, D.J. and Clarke, T.A. (2012) The crystal structure of the extracellular 11-heme cytochrome UndA reveals a conserved 10-heme motif and defined binding site for soluble iron chelates. Structure20, 1275—1284.
Take hexabenzo[bc,ef,hi,kl,no,qr]coronene, one of the subjects of the single-molecule visualisation study published last week in Science [1]. One way to draw it shown in diagram (a):
(a)
I chose this one (out of many other possible Kekulé representations) because I can reproduce it on a paper napkin (beermat, Post-it note, you name it). If you look carefully, you will notice that the central ring and the six outermost rings are connected with single bonds.
(b)
Continuing the paper-napkin-doodle argument, it is even easier to draw a circle inside of each ring as in all-delocalised representation (b). However, that would not be a preferred diagram from IUPAC point of view [2, GR-6.5]: for example, benzene ⏣ is acceptable but ⌬ is preferred. Moreover, “it is generally not acceptable to use curves in two adjacent fused rings”. Still, I’d stick with circles.
The question is, do I have to draw a circle within each ring? Of course not. If I draw seven aromatic rings and connect the with single bonds as shown in (c), the resulting structure will be the same. In this way, I can even save some ink (graphite, chalk, etc.)
(c)
Without the circles, the six rings that surround the central ring in (c) start to look, well, more empty. Using the noncontact atomic force microscopy (NC-AFM), the team behind the study [1] were able to show (and in this case “to show” really means “to show”), that those rings are indeed slightly larger. The C—C bonds in the central ring (i-bonds, 1.417 Å) are 0.03 Å shorter than the bonds connecting that ring with the six outermost rings (j-bonds, 1.447 Å).
Gross, L., Mohn, F., Moll, N., Schuler, B., Criado, A., Guitián, E., Peña, D., Gourdon, A. and Meyer, G. (2012) Bond-order discrimination by atomic force microscopy. Science337, 1326—1329.
Brecher, J. (2008) Graphical representation standards for chemical structure diagrams (IUPAC Recommendations 2008). Pure Appl. Chem.80, 277—410.
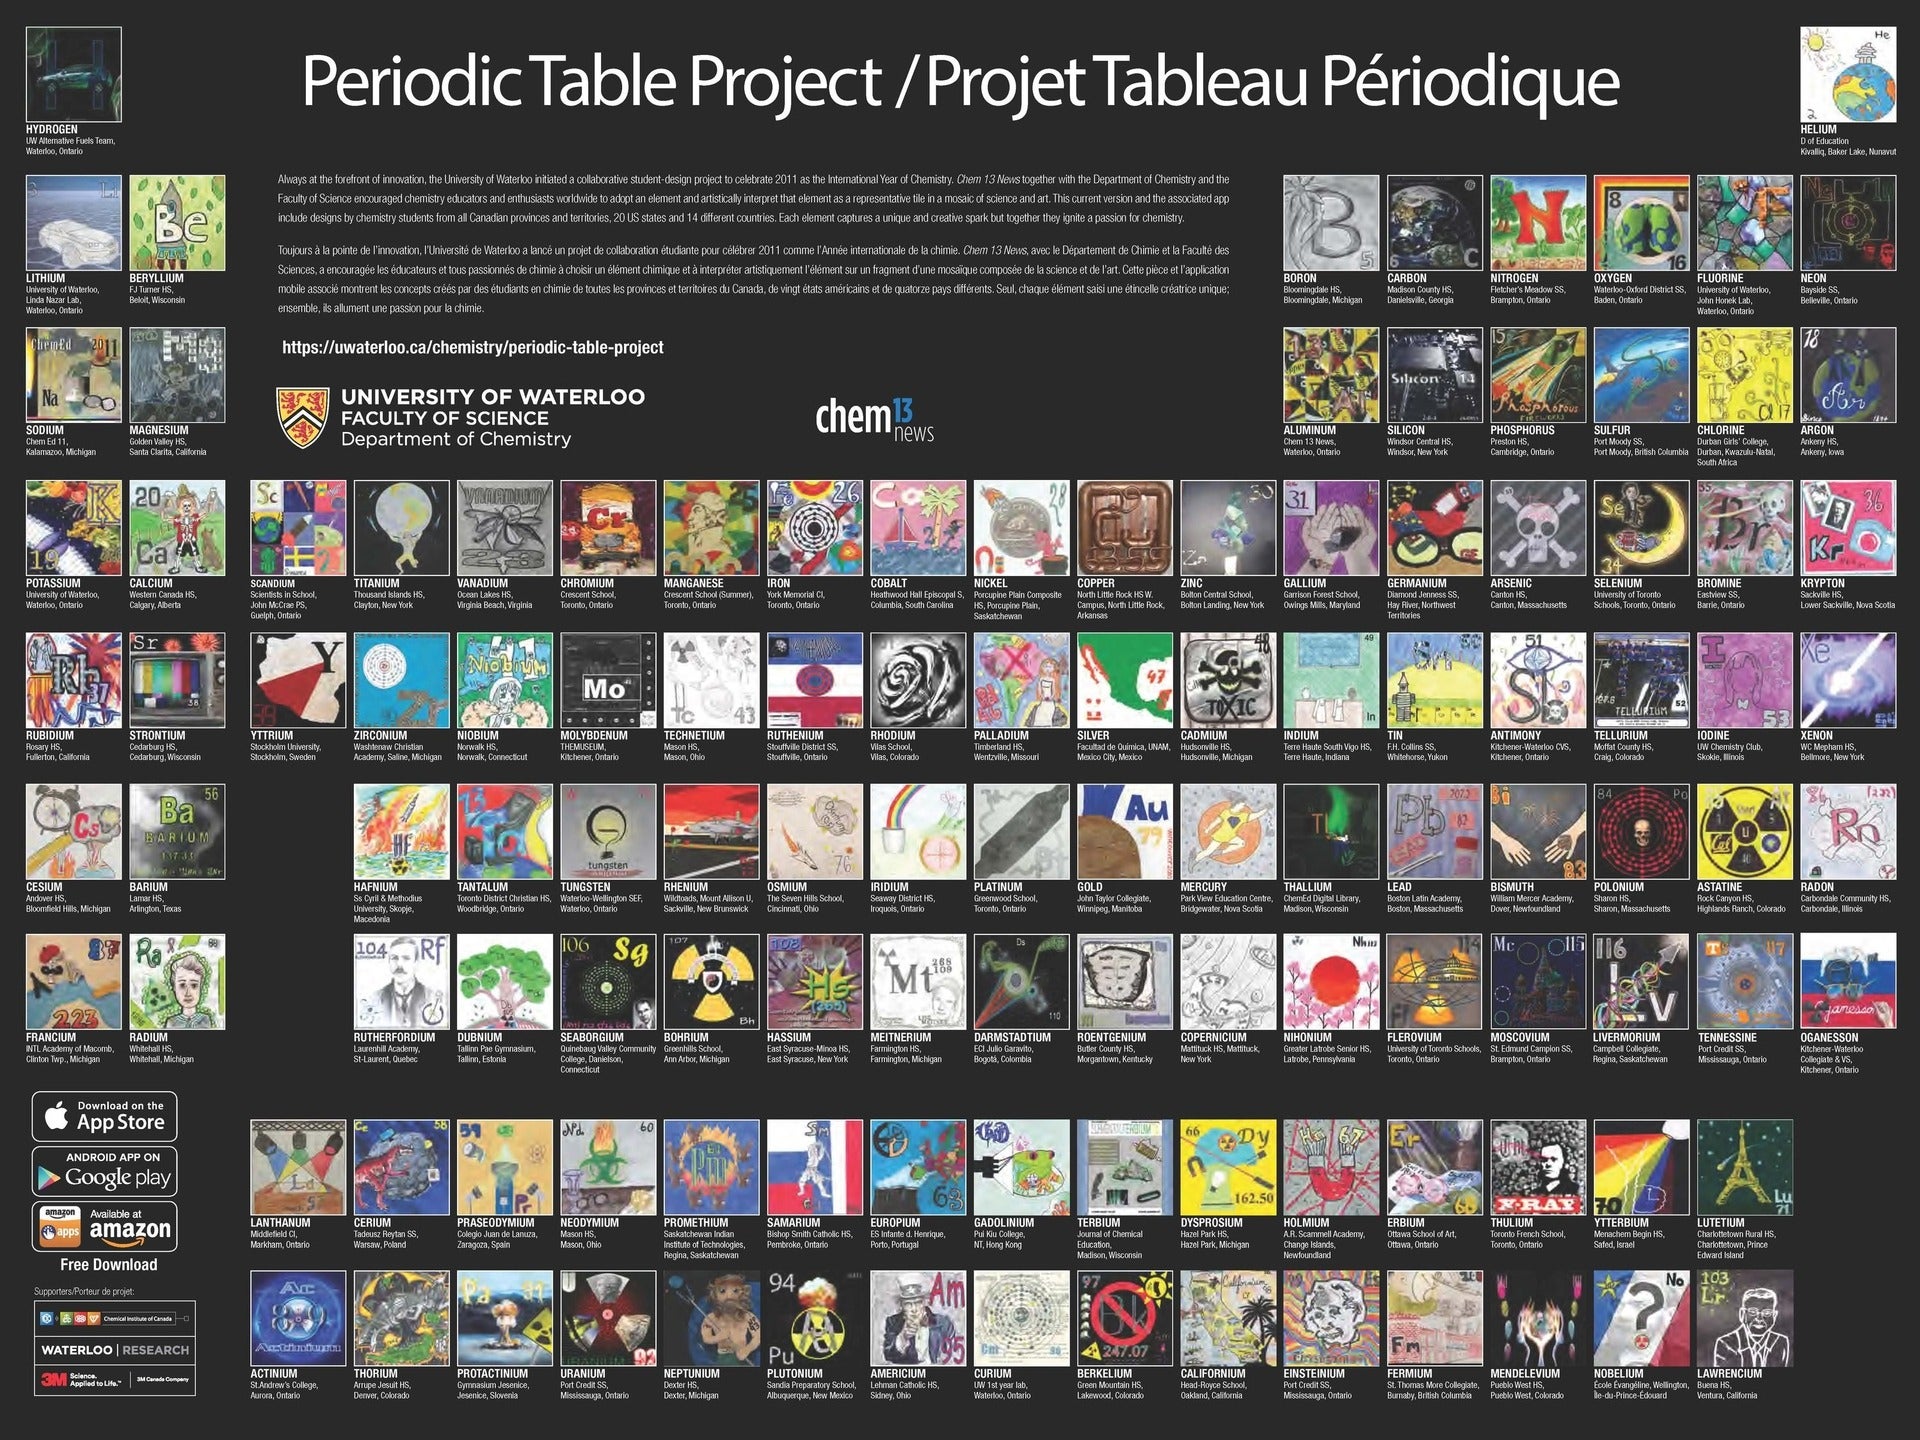
The cover of the latest issue of Chemistry International features a fragment of Homenatge als elements (Hommage to the Elements) by the Catalan artist Eugènia Balcells. The display in the atrium of the Physics and Chemistry Library at the University of Barcelona takes the shape of the periodic table where each chemical element is represented by its emission spectrum [1]. According to the artist’s website, it “was born as a counterpoint” to the video installation Freqüències (Frequencies).
The Periodic Table Project at the University of Waterloo, Canada is another work of art,
designed by chemistry students from all Canadian provinces and territories, 20 U.S. states, and 14 countries. It can be viewed online and is available as a printed poster.
Also, as a free app for Apple or Android.
Both the Periodic Table Project and Hommage to the Elements use the medium-long form periodic table. The “IUPAC Periodic Table of the Elements” as published at the back of Chemistry International (in this issue, for the first time it includes flerovium and livermorium) has the same shape. Why the quotes? Because, as a matter of fact, there is no such thing as IUPAC-approved periodic table. Jeffery Leigh wrote three years ago that “there is unlikely to be a definitive IUPAC-recommended form of the periodic table” [2]. In my humble opinion, this is unfortunate that IUPAC refuses to take a position on this matter. Eric Scerri takes a view that “IUPAC should in fact take a stance on the membership of particular groups even if this has not been the practice up to this point” [3]. To illustrate this point, he goes to address the Group 3 question. He argues that the most logical composition of this group is Sc, Y, Lu and Lr (rather than Sc, Y, La and Ac), as shown below.
1
2
3
4
5
6
7
8
9
10
11
12
13
14
15
16
17
18
H
He
Li
Be
B
C
N
O
F
Ne
Na
Mg
Al
Si
P
S
Cl
Ar
K
Ca
Sc
Ti
V
Cr
Mn
Fe
Co
Ni
Cu
Zn
Ga
Ge
As
Se
Br
Kr
Rb
Sr
Y
Zr
Nb
Mo
Tc
Ru
Rh
Pd
Ag
Cd
In
Sn
Sb
Te
I
Xe
Cs
Ba
La
Ce
Pr
Nd
Pm
Sm
Eu
Gd
Tb
Dy
Ho
Er
Tm
Yb
Lu
Hf
Ta
W
Re
Os
Ir
Pt
Au
Hg
Tl
Pb
Bi
Po
At
Rn
Fr
Ra
Ac
Th
Pa
U
Np
Pu
Am
Cm
Bk
Cf
Es
Fm
Md
No
Lr
Rf
Db
Sg
Bh
Hs
Mt
Ds
Rg
Cn
Nh
Fl
Mc
Lv
Ts
Og
1
2
3
4
5
6
7
8
9
10
11
12
13
14
15
16
17
18
19
20
21
22
23
24
25
26
27
28
29
30
31
32
In addition to arranging all the elements in a more correct sequence of increasing atomic numbers, the decision to move to a long-form or 32-column table forces the periodic table designer towards just one possible option regarding the question of which elements to place in group 3.
I entirely agree with that. And yet Scerri stops short of proposing that IUPAC should support the 32-column (or “long, long form”, as Leigh put it) periodic table; in fact he explicitly states that he is not suggesting a change of IUPAC policy, viz. that of doing nothing about it. Why? That would be one of the most important and immediately noticeable changes sponsored by IUPAC in decades.
The problem is, sorting out the Group 3 does not resolve the problem how to number the f-block columns. If we stick with 18 groups (blue numbering on the top of the table), that would be really unfair towards the lanthanoids and actinoids. Why don’t we simply number groups from 1 to 32 (red numbers on the bottom of the table)? Sc, Y, Lu and Lr will find themselves in Group 17. So what? It’s not that many people will miss the current Group 17 — nobody really calls these elements anything but “halogens”. And 32 is even more convenient number than 18. I think it’s about time IUPAC took the lead and said how exactly the periodic table should look like.
The X-ray crystal structure of Pseudomonas aeruginosa bacterioferritin (Pa-BfrB) in complex with bacterioferritin-associated ferredoxin (Pa-Bfd) has been solved at 2.0 Å resolution [1, 2].
As the first example of a ferritin-like molecule in complex with a cognate partner, the structure provides unprecedented insight into the complementary interface that enables the [2Fe-2S] cluster of Pa-Bfd to promote heme-mediated electron transfer through the BfrB protein dielectric (~18 Å), a process that is necessary to reduce the core ferric mineral and facilitate mobilization of Fe2+. The Pa-BfrB—Bfd complex also revealed the first structure of a Bfd, thus providing a first view to what appears to be a versatile metal binding domain ubiquitous to the large Fer2_BFD family of proteins and enzymes with diverse functions.
Yao, H., Wang, Y., Lovell, S., Kumar, R., Ruvinsky, A.M., Battaile, K.P., Vakser, I.A. and Rivera, M. (2012) The structure of the BfrB—Bfd complex reveals protein—protein interactions enabling iron release from bacterioferritin. J. Am. Chem. Soc.134, 13470—13481.
Teh, A.-H., Saito, J.A., Baharuddin, A., Tuckerman, J.R., Newhouse, J.S., Kanbe, M., Newhouse, E.I., Rahim, R.A., Favier, F., Didierjean, C., Sousa, E.H.S., Stott, M.B., Dunfield, P.F., Gonzalez, G., Gilles-Gonzalez, M.A., Najimudin, N. and Alam, M. (2011) Hell’s Gate globin I: An acid and thermostable bacterial hemoglobin resembling mammalian neuroglobin. FEBS Lett.585, 3250—3258.
Pechkova, E., Scudieri, D., Belmonte, L. and Nicolini, C. (2012) Oxygen-bound Hell’s gate globin I by classical versus LB nanotemplate method. J. Cell Biochem.113, 2543—2548.
Five years ago, Schemberg et al. reported the crystal structure of molybdenum/tungsten storage protein from Azotobacter vinelandii complexed with polyoxotungstates [1, 2].
Now Kowalewski et al. report the 1.6 Å X-ray structure of the same protein containing a variety of polyoxomolybdate clusters, from Mo3 to Mo8 [3].
Some N2-fixing bacteria prolong the functionality of nitrogenase in molybdenum starvation by a special Mo storage protein (MoSto) that can store more than 100 Mo atoms. The presented 1.6 Å X-ray structure of MoSto from Azotobacter vinelandii reveals various discrete polyoxomolybdate clusters, three covalently and three noncovalently bound Mo8, three Mo5–7, and one Mo3 clusters, and several low occupied, so far undefinable clusters, which are embedded in specific pockets inside a locked cage-shaped (αβ)3 protein complex. <...> The formed polyoxomolybdate clusters of MoSto, not detectable in bulk solvent, are the result of an interplay between self- and protein-driven assembly processes that unite inorganic supramolecular and protein chemistry in a host–guest system.
Schemberg, J., Schneider, K., Demmer, U., Warkentin, E., Müller, A. and Ermler, U. (2007) Towards biological supramolecular chemistry: a variety of pocket-templated, individual metal oxide cluster nucleations in the cavity of a Mo/W-storage protein. Angewandte Chemie International Edition46, 2408—2413.
Kowalewski, B., Poppe, J., Demmer, U., Warkentin, E., Dierks, T., Ermler, U. and Schneider, K. (2012) Nature’s polyoxometalate chemistry: X-ray structure of the Mo storage protein loaded with discrete polynuclear Mo–O clusters. J. Am. Chem. Soc.134, 9768—9774.
XplA is a P450-flavodoxin fusion enzyme that mediates the metabolism of the military explosive RDX (1,3,5-trinitro-1,3,5-triazinane) in Rhodococcus rhodochrous 11Y [1]. Bui et al. have conducted a detailed spectroscopic and crystallographic study of this unusual hemoflavoprotein [2, 3].
The XplA P450 has evolved as a reductase (rather than oxidase) of RDX and structural alterations to its heme- and FMN-binding domains have led to reduction potentials for low-spin heme iron Fe3+/Fe2+ and FMNSQ/HQ couples being much more positive than those seen in typical P450s and flavodoxins, but consistent with non-oxidative P450 catalysis. These evolutionary steps have also led to a constricted P450 active site with high affinity for RDX (but also for the small heterocyclic inhibitor imidazole), and also to substantially diminished affinity for FMN in the flavodoxin domain.
Rylott, E.L., Jackson, R.G., Sabbadin, F., Seth-Smith, H.M.B., Edwards, J., Chong, C.S., Strand, S.E., Grogan, G. and Bruce, N.C. (2011) The explosive-degrading cytochrome P450 XplA: biochemistry, structural features and prospects for bioremediation. Biochim. Biophys. Acta1814, 230—236.
Bui, S.H., McLean, K.J., Cheesman, M.R., Bradley, J.M., Rigby, S.E.J., Levy, C.W., Leys, D. and Munro, A.W. (2012) Unusual spectroscopic and ligand binding properties of the cytochrome P450-flavodoxin fusion enzyme XplA. J. Biol. Chem.287, 19699—19714.
Crystal structures were determined for the Rieske-type monooxygenase, stachydrine demethylase, in the unliganded state (at 1.6 Å) and in the product complex (at 2.2 Å) [1—3].
Daughtry, K.D., Xiao, Y., Stoner-Ma, D., Cho, E., Orville, A.M., Liu, P. and Allen, K.N. (2012) Quaternary ammonium oxidative demethylation: X-ray crystallographic, resonance Raman, and UV-visible spectroscopic analysis of a Rieske-type demethylase. J. Am. Chem. Soc.134, 2823—2834.
The crystal structure of the FAD/NADPH-binding domain of the Bacillus megaterium flavocytochrome P450 BM3 has been solved in both the absence and presence of the ligand NADP+ [1—3].
Joyce, M.G., Ekanem, I.S., Roitel, O., Dunford, A.J., Neeli, R., Girvan, H.M., Baker, G.J., Curtis, R.A., Munro, A.W. and Leys, D. (2012) The crystal structure of the FAD/NADPH-binding domain of flavocytochrome P450 BM3. FEBS J.279, 1694—1706.
Quadruple and higher order metal—metal bonds are known for transition metals, lanthanoids and actinoids. But for main group elements? Using four different computational methods, Shaik et al. [1] show that
C2 and its isoelectronic molecules CN+, BN and CB− (each having eight valence electrons) are bound by a quadruple bond. The bonding comprises not only one σ- and two π-bonds, but also one weak ‘inverted’ bond, which can be characterized by the interaction of electrons in two outwardly pointing sp hybrid orbitals.
According to Shaik, the existence of the fourth bond in C2 suggests that it is not really diradical C22• [2]:
If C2 were a diradical it would immediately form higher clusters. I think the fact that you can isolate C2 tells you it has a barrier, small as it may be, to prevent that.
Shaik, S., Danovich, D., Wu, W., Su, P., Rzepa, H.S. and Hiberty, P.C. Quadruple bonding in C2 and analogous eight-valence electron species. Nature Chemistry4, 195—200.